AI visibility ratio: how to compare GSC AI impressions with total impressions
Divide Search Console's generative AI impressions by total Web impressions and you get the share of your Google visibility happening inside AI Overviews and AI Mode. Here's how to calculate it, segment it and keep it honest.
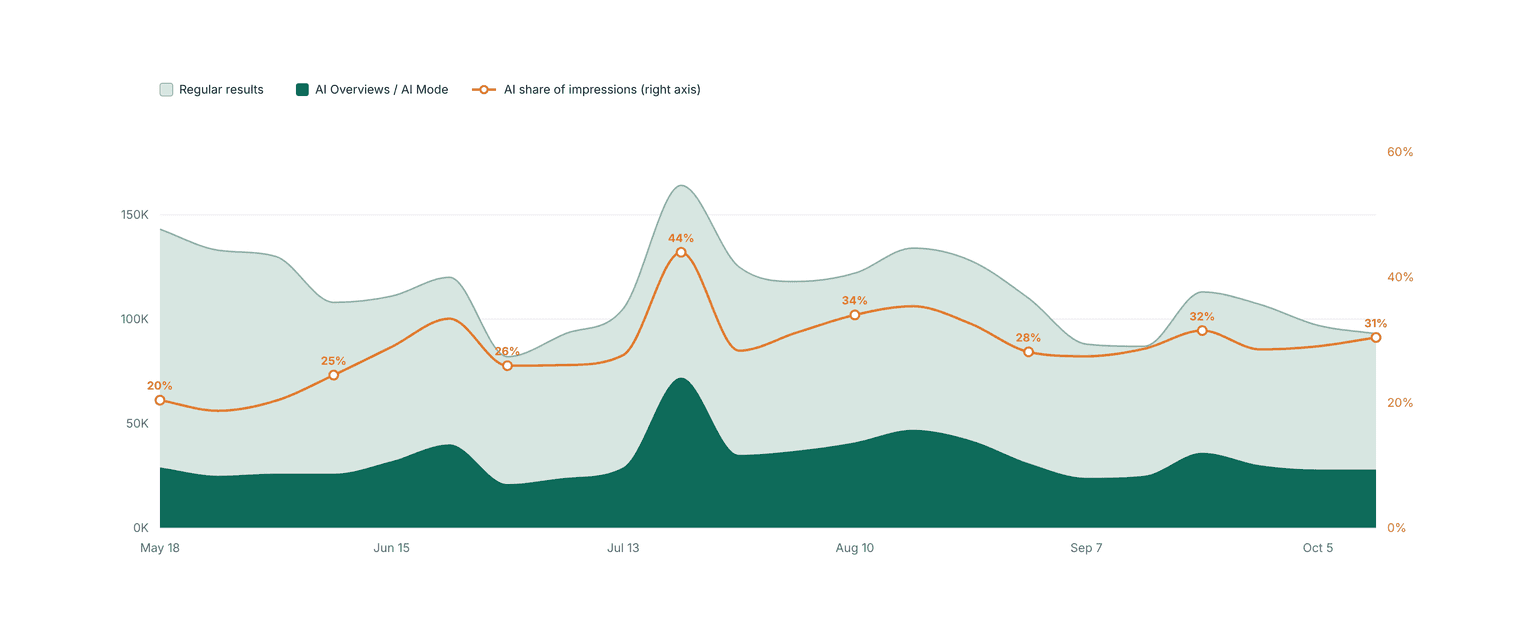
Divide generative AI impressions by total Web impressions for the same pages and dates. The result is the share of your Google visibility that happens inside AI Overviews and AI Mode. Across 22 weeks on a US services website, that share averaged 29% and ranged from 20% to 44% week to week. That's large enough to need its own line in every SEO report.
AI visibility ratio = Generative AI impressions / Total Web impressionsWhy compare AI impressions with total impressions at all?
An absolute AI impression count tells you AI features show your site. It doesn't tell you whether that's a small side effect or the main way people now see you. The ratio puts AI exposure in context, which raw counts can't:
- It flags where search behavior is shifting. Topic clusters with a high ratio are the ones where users increasingly get answers before they reach the blue links. CTR is most likely to come under pressure there.
- It separates visibility loss from a shift in format. When total impressions fall but AI impressions hold, you're losing regular rankings. When both fall, demand is dropping.
- It ranks content for AI optimization. Content types with a high ratio are the ones to optimize for citation. Low-ratio types are still a classic ranking problem.
- It explains spikes. A sudden jump in total impressions with a jump in the ratio means AI features drove it, and those visits rarely turn into proportional clicks.
- It gives CTR changes context. A falling Web CTR alongside a rising ratio points first to how the results page is laid out, not to your title tags.
How do you calculate it, step by step?
- Export the generative AI report. In Search Console, open the Generative AI performance report and export impressions by date and page. Add device and country if you plan to segment.
- Export the matching Web report. Same date range, search type Web, same dimensions: clicks, impressions, CTR, position.
- Use full weeks. Aggregate both exports Monday to Sunday. Daily ratios are noisy, and partial weeks distort the first and last points.
- Normalize URLs. Strip parameters and fragments, and map variants to the canonical URL before joining.
- Join at the same level. Page with page, property with property. Property charts count one impression per AI result, while page tables can credit several of your URLs for the same result. Mixing the two inflates page ratios.
- Calculate the ratio, and keep the two numbers it's built from. Store AI impressions, total impressions and the regular remainder (total minus AI) for every row.
What does it look like on a real site?
We charted weekly Google impressions for a US services website from May 18 to October 18, 2026, with AI Overviews / AI Mode stacked under regular results and the AI share as a line.
How we prepared the chart
- Source: the Search Console generative AI report for AI impressions and the Web performance report for total impressions, same property, same dates.
- Time grain: 22 full Monday–Sunday weeks, starting May 18, 2026, the first full week the report covers.
- Regular results: total Web impressions minus AI impressions. Because AI impressions are already inside the Web total, subtracting them is the only way to show the two as stacked layers without double counting.
- AI share: AI impressions divided by total Web impressions, plotted on its own right-hand axis so its movement isn't squashed by the impression scale.
- Level: property-level totals on both sides, so the numerator and denominator are counted the same way.
How to read it
- Watch both layers, not just the share line. The AI layer is absolute AI exposure. The regular layer is everything else. The share line only tells you how they compare.
- The share rises while AI stays flat. Over the first four weeks AI impressions averaged about 26K a week, and over the last four about 31K, up roughly 15%. Regular results fell from about 102K to about 72K, roughly 30%. The share climbed from 20% to 31% mainly because the denominator shrank.
- The spike is AI-driven. In the week of July 20, total impressions jumped by about 59K over the week before, and AI impressions by about 43K. Roughly three-quarters of the spike happened inside AI answers, which is why the share peaked at 44%.
- A plateau follows the spike. Through most of August the AI layer stayed thicker than before July, with the share between 31% and 35%, before settling around 27–32% in September and October.
Read the share alone and AI exposure grew by half. Read the layers and AI held steady while regular results lost ground. That's why the components have to travel with the ratio.
How should you segment it?
A site-wide ratio hides most of the signal. Group pages by content type first.
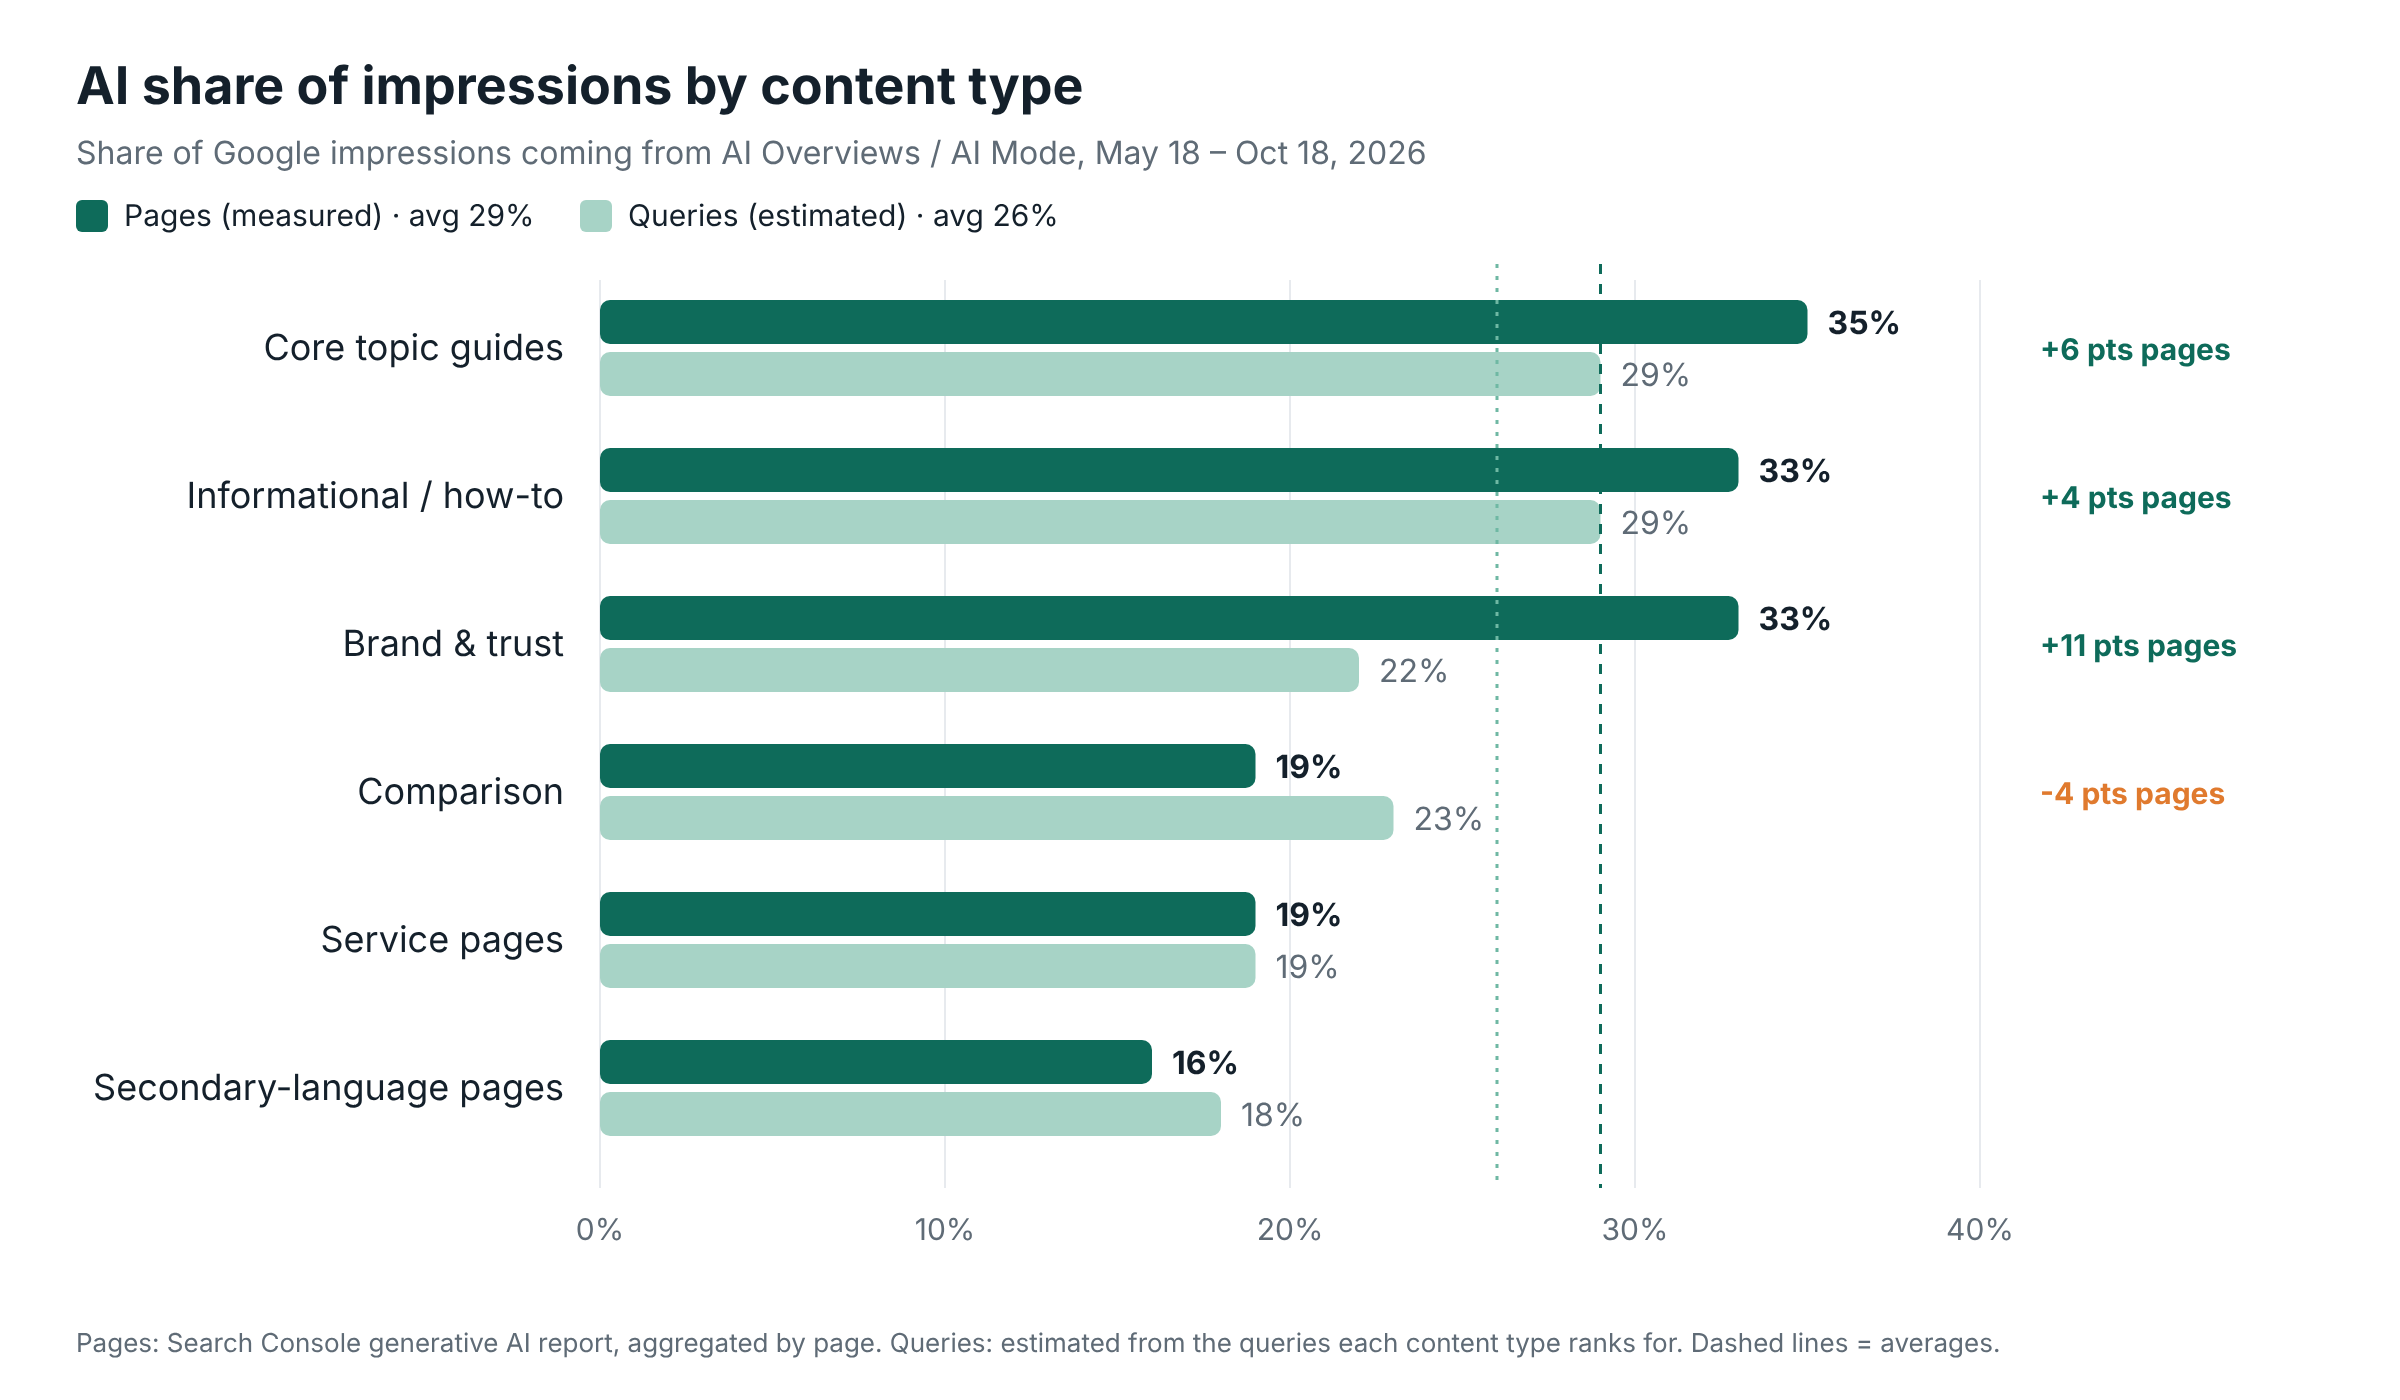
AI share by content type. Pages are measured directly in Search Console. Queries are estimated from the queries each content type ranks for.
Google reports AI visibility by page, not by query. The page bars are measured. The query bars estimate the same share from each content type's ranking queries, so you can see whether pages win AI exposure in line with their query footprint. The gap between the two bars is where the insight sits:
- Page share above query share (Brand & trust, +11 points): the pages are pulled into AI answers more often than their queries suggest. They're strong citation candidates, so protect and extend them.
- Query share above page share (Comparison, −4 points): the queries trigger AI features, but these pages appear in them less often. This is a citation gap, and competitors are probably filling that slot.
- Both high (topic guides and informational content, 29–35%): the core battleground for AI citations, and the pages most exposed to zero-click behavior.
- Both low (service and secondary-language pages, 16–19%): AI features matter less here. Classic rankings still decide visibility.
Once the content-type view is stable, add device and country.
Which mistakes distort the ratio?
- Treating it as a traffic channel. AI impressions are a subset of Web impressions, not a separate bucket.
- Reading it without the components. A rising share can mean AI growth, regular-results decline or both.
- Calculating AI CTR. The generative AI report has no clicks. Web CTR is blended and can't be split.
- Mixing aggregation levels. Property-level AI totals against page-level Web totals give ratios that don't mean anything.
- Averaging across content types. A 29% site average can hide a 16% segment and a 35% segment that need opposite strategies.
What should go in your reporting?
- A weekly chart of AI impressions stacked under regular results, with the share plotted as a line on its own axis.
- The ratio by content type, pages next to queries, refreshed monthly.
- A watch list of pages where AI impressions rise in absolute terms while Web CTR falls.
- Clicks and conversions next to every ratio, so exposure is never confused with business results.
Is your business in the answer?
One report, four AI platforms, the questions your customers actually ask.